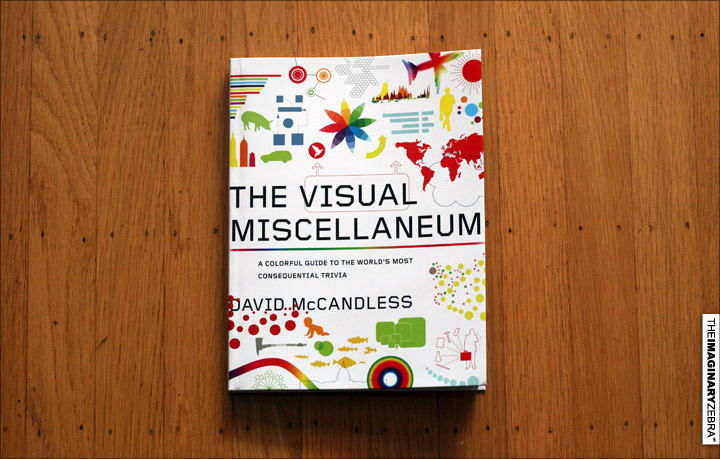
I came across this book the other day at Border’s(where I jot down the name, then got it via Amazon![]() to save a couple of bucks). Blew my mind. Just judge by its cover, the intensive graphics were enough to give me a seizure.
to save a couple of bucks). Blew my mind. Just judge by its cover, the intensive graphics were enough to give me a seizure.
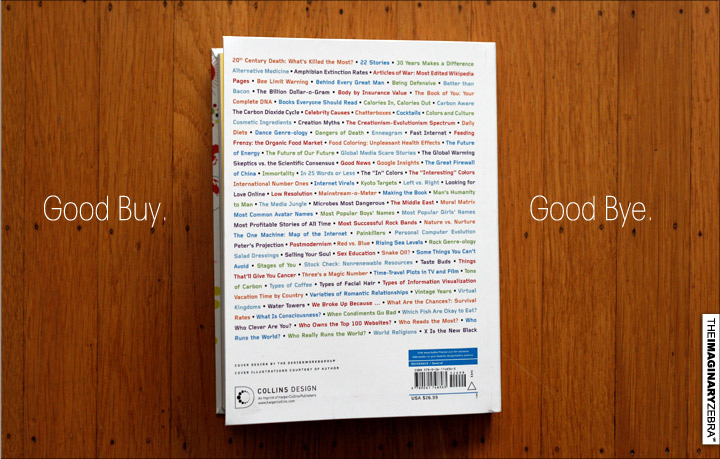
by David McCandless. 
Here’s what the book’s about.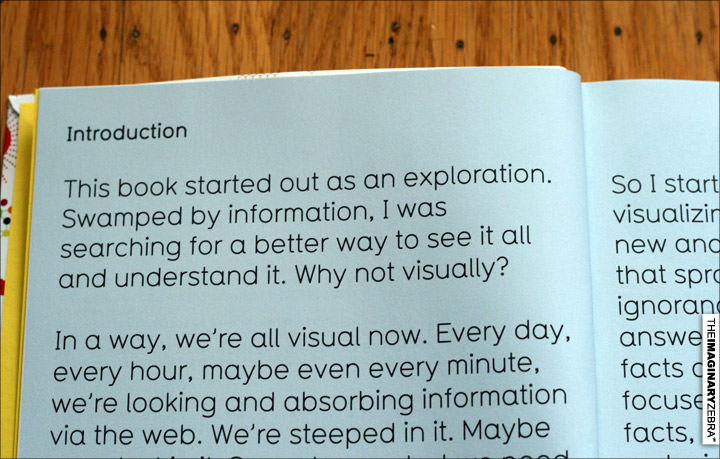
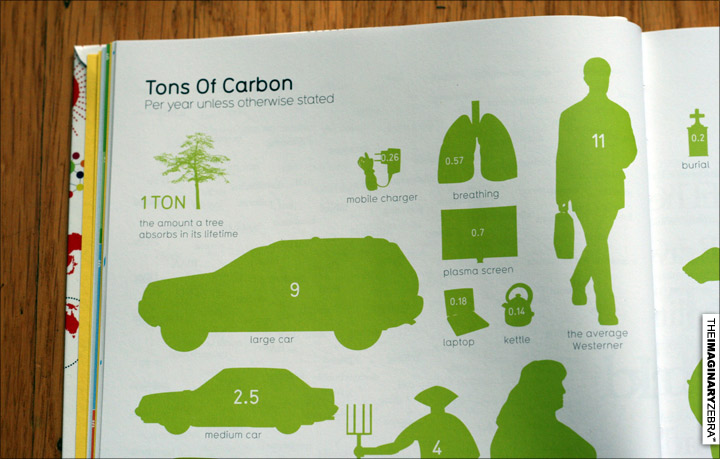
You’re right – David gathered all kinds of info/statistics about the world and made them into creative info-charts. Charts waaay better than the bars and pie charts that aimed to bored the shit out of you.
Some glimpse of the content: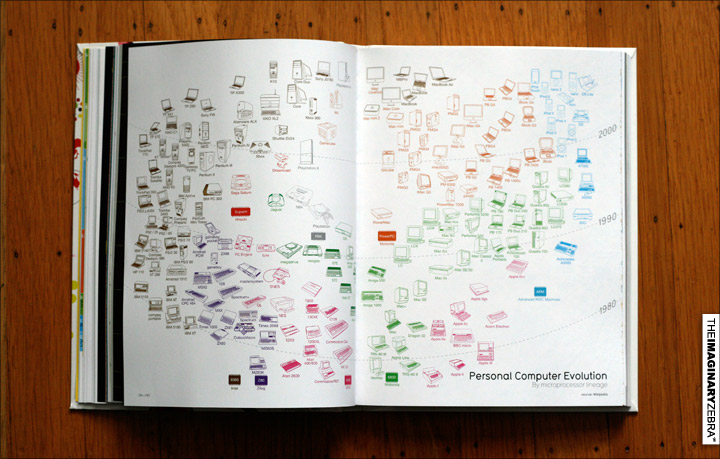
“A table of condiments that periodically go bad”
We have salsa on the top right – goes bad in 2 days. And sugar on the bottom right – never goes bad.
On the right – top left – body by nerve endings.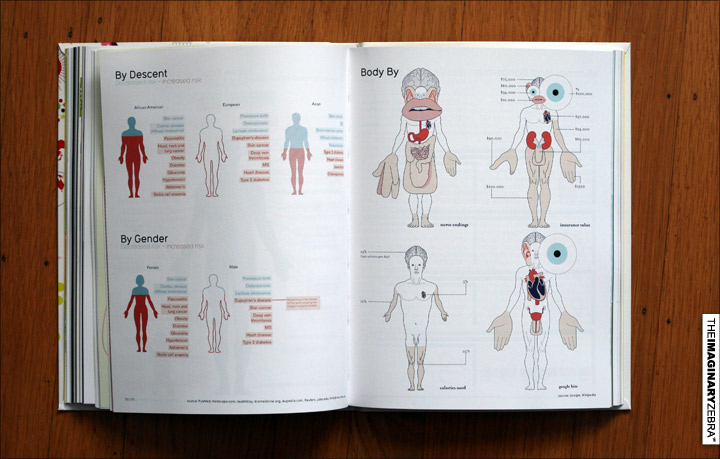
Proportion of how much (in billions) we spend on things.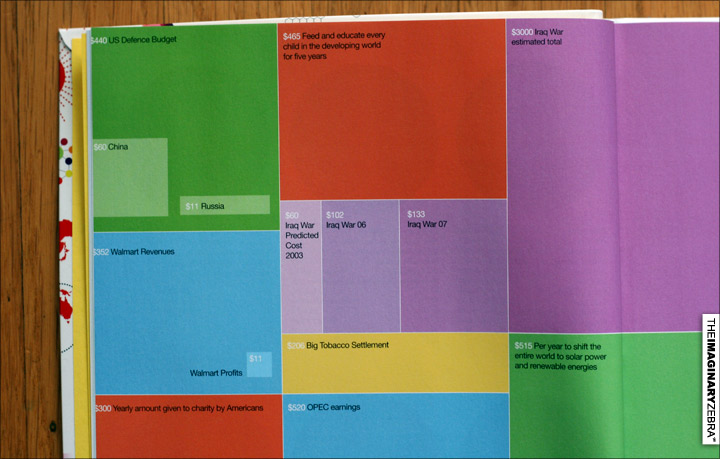
World’s top 100 websites – were actually owned by a few elites. 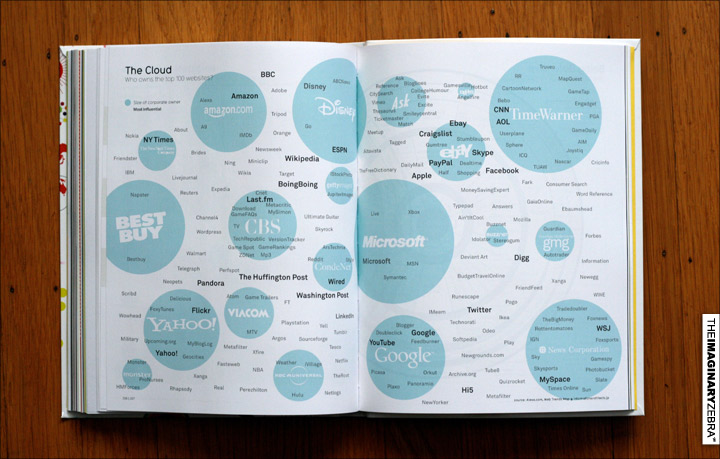
It’s got about 240 pages worth of things you should probably know for dining table conversations.
-Benson|| Twitter || the movement|| The Imaginary Zebra website